The video begins at 4:14.
PRESENTATION ARCHIVE
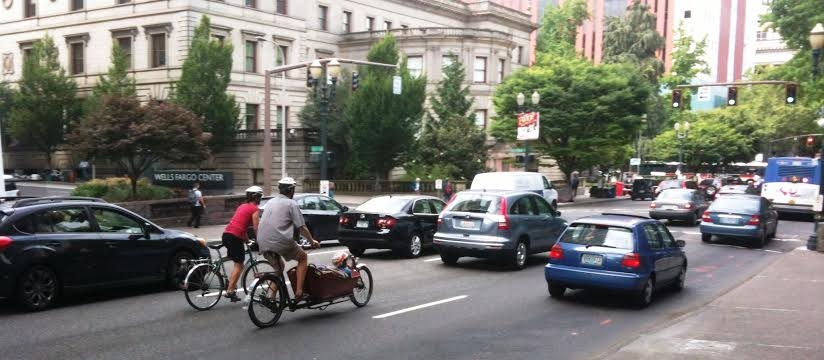
Active travel such as walking and bicycling can lead to health benefits through an increase in physical activity. At the same time, more active travelers breath more and so can experience high pollution inhalation rates during travel. This webinar will review the state of knowledge about how roadway and traffic characteristics impact air pollution risks for bicyclists, including the latest PSU research quantifying bicyclists' uptake of traffic-related air pollution using on-road measurements in Portland. The PSU research team including Alex Bigazzi, Jim Pankow, and Miguel Figliozzi quantified bicyclist exposure concentrations on different types of roadways, respiration responses to exertion level, and changes in blood concentrations of pollutants. Implications for planners, engineers, and policy-makers will be discussed, including guidance for more pollution-conscious bicycle network planning and design. Additionally, ways for individual travelers to reduce their air pollution risks will be discussed.
This 60-minute webinar is eligible for one hour of training which equals 1 CM or 1 PDH. NITC applies to the AICP for Certification Maintenance credit for each webinar. We will provide an attendance certificate...
Read moreWatch video
View slides: Bell Presentation (PDF)
Summaries:
Identification and Characterization of PM2.5 and VOC Hot Spots on Arterial Corridor by Integrating Probe Vehicle, Traffic, and Land Use Data: The purpose of this study is to explore the use of integrated probe vehicle, traffic and land use data to identify and characterize fine particulate matter (PM2.5) and volatile organic compound (VOC) hot spot locations on urban arterial corridors. An emission hot spot is defined as a fixed location along a corridor in which the mean pollutant concentrations are consistently above the 85th percentile of pollutant concentrations when considering all other locations along the corridor during the same time period. In order to collect data for this study, an electric vehicle was equipped with instruments designed to measure PM2.5 and VOC concentrations. Second-by-second measurements were performed for each pollutant from both the right and left sides of the vehicle. Detailed meteorological, traffic and land use data is also...
View slides
Watch video:
Car crashes are still a leading cause of death in the United States, with vulnerable road users like bicyclists and pedestrians being injured or killed at rates that outpace their mode share.
Planners, engineers, and advocates are increasingly adopting Vision Zero and Tactical Urbanism approaches and trying to better understand the underlying causes...
Read moreThe video starts at 0:58.
View slides
Abstract: Walking and bicycling are being promoted as transportation options that can increase the livability and sustainability of communities, but the automobile remains the dominant mode of transportation in all United States metropolitan regions. In order to change travel behavior, researchers and practitioners need a greater understanding of the mode choice decision process, especially for walking and bicycling.
This presentation will summarize dissertation research on factors associated with walking and bicycling for routine travel purposes, such as shopping. More than 1,000 retail pharmacy store customers were surveyed in 20 San Francisco Bay Area shopping districts in fall 2009, and 26 follow-up interviews were conducted in spring and summer 2010. Mixed logit models showed that walking was associated with shorter travel distances, higher population densities, more street tree canopy coverage, and greater enjoyment of walking. Bicycling was associated with shorter travel distances, more bicycle facilities, more bicycle parking, and greater enjoyment of bicycling. Respondents were more likely to drive when they perceived a high risk of crime, but automobile use was discouraged by higher employment densities, smaller parking lots,...
Read moreRoom 315 Engineering Building (ITS Lab)
If American cities are to serve the mainstream population of traffic-intolerant bicyclists, we need a broad range of low-stress facility types that can be applied depending on traffic and space constraints. This seminar will focus on two kinds of bicycle accommodations. A “Bicycle Priority Lane” is a shared lane treatment, like the shared lane arrow or “sharrow” that is becoming popular, intended for streets lacking the space to provide a dedicated bike lane. It enhances the sharrow by providing longitudinal markings that define a “lane within a lane,” drawing from “advisory lanes” (UK) and “suggestion lanes” (NL). We show how defining the bicyclist’s space objectively with road marking frees bicyclists from the stress of negotiating for operating space with motorists.
Separated paths or cycle tracks are bike paths along a road that are physically separated from moving traffic by a curb, median, or parking lane. For decades, they have been the mainstay of bicycle networks in the Netherlands and in Montreal, but have been shunned by US planners due to misplaced safety concerns. We will expose the flaws of the studies used to discredit separated paths, and discuss their safety record in the Netherlands and in Montreal. Practical issues in cycle track design will be discussed based on Montreal’s experience of the last two decades.
View slides
Watch video:
The Community Cycling Center has been at the business of broadening access to bicycling for 22 years. Far before anyone was talking about "equity" in the world of bike commuting and advocacy, the Community Cycling Center was working directly with youth of color to make...
Read more