PRESENTATION ARCHIVE
Miss the webinar or want a look back?
OVERVIEW
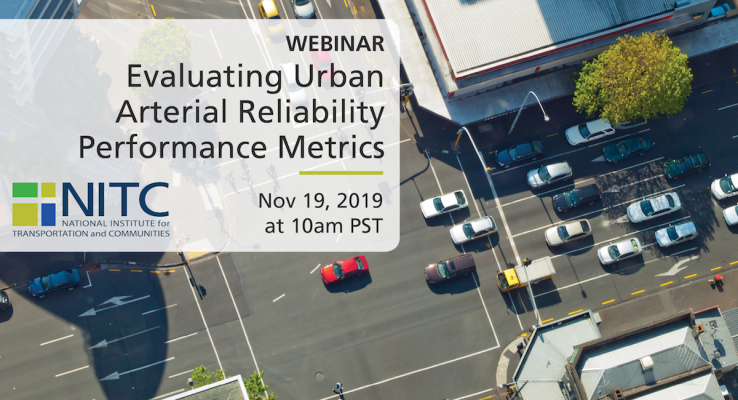
With worsening congestion, travel time reliability is increasingly becoming as critical as average travel times in affecting travel choices. Researchers from Portland State University (PSU) partnered with Washington County, Oregon to offer data-driven strategies in prioritizing funding for travel time reliability improvements on their urban arterials. The vast majority of existing research on travel time reliability has focused exclusively on freeways. Avinash Unnikrishnan, Sirisha Kothuri and Jason C. Anderson leveraged Bluetooth sensors provided and deployed by Bluemac Analytics to identify problem areas in the county. Set up at intersections throughout Washington County, the sensors are able to calculate travel time from one intersection to another by matching Bluetooth signals from devices in people's cars. The researchers evaluated the Bluetooth travel time data to understand the temporal variation in travel time reliability metrics on these urban arterials, including factors related to time of day, weather, and holidays....
Read moreThe video begins at 3:22.
Steve Gehrke (CEE PhD) - Application of Geographic Perturbation Methods to Residential Locations in the Oregon Household Activity Survey: Proof of Concept
Travel demand models have advanced from zone-based methods to favor activity-based approaches that require more disaggregate data sources. Household travel surveys gather disaggregate data that may be utilized to better inform advanced travel demand models and also improve the understanding of how nonmotorized travel is influenced by a household’s surrounding built environment. However, the release of these disaggregate data is often limited by a confidentiality pledge between the household participant and survey administrator. Concerns regarding the disclosure risk of survey respondents to household travel surveys must be addressed before these household-level data may be released at their disaggregate geography. In an effort to honor this confidentiality pledge and facilitate the dissemination of valuable travel survey data, this research: (i) reviews geographical perturbation methods that seek to protect respondent confidentiality; (ii) outlines a procedure for implementing one promising practice, referred to as the donut masking technique; and (iii) demonstrates a proof of concept for this technique on ten respondents to a household activity travel survey in the Portland metropolitan region. To examine the balance...
Read moreView Blanc's slides
View Mathez's slides
The video begins at 0:33.
Following the 2015 annual meeting of the Transportation Research Board, this Friday seminar will showcase some of Portland State University's student TRB research.
Presenters:
Bryan Blanc, GRA in civil and environmental engineering
Leveraging Signal Infrastructure for Non-Motorized Counts in a Statewide Program: A Pilot Study
Summary: Transportation agencies are beginning to explore and develop non-...
Read more
In honor of our 10-year anniversary, we’re trying something a little different. Instead of brief sessions that introduce you to a topic– we will be offering fifteen half-day workshops that focus on skill building and providing the tools to apply the latest research to practice. These will be hands-on, immersive learning experiences in a small classroom setting.
REGISTRATION
This event is a la carte, and pricing is per workshop. You may attend as few as one, or as many as four workshops.
- Half-Day Workshop (general admission): $95
- Half-Day Workshop (student rate): $50
THE PROGRAM
⇨SEE THE FULL SCHEDULE AND DETAILS
- Survey Design: Asking the Right Questions
- Bicycle/Pedestrian Focused Signal Timing Strategies: What, When, Where, Why, and How?
- Activating Community Opportunities Using Transportation Organizations as Assets
- Cost Accounting for Program and Budget Planning Today and Tomorrow
- Data Analysis for Smarties Who Forgot What They Learned in College
- What’s New in the HCM 6th Edition?
- Ecological Momentary Assessment Methods with Transportation Disadvantaged Populations
- Calculating...
We are committed to making decisions that promote the success and well-being of our campus community. Like an increasing number of universities nationwide, Portland State is taking steps to respond to the global pandemic. Until further notice, all live events hosted by TREC will be online only.
Friday Transportation Seminars at Portland State University have been a tradition since 2000. You can join us online at 11:30 AM.
PRESENTATION ARCHIVE
THE TOPIC
As transit agencies modernize their fare payment systems, opportunities to pay with cash are reduced. This speeds boarding and lowers the cost of operations while also creating new sources of ridership data. Arguably, service is improved for riders as well as payment systems could work across modes,...
Read moreWatch video
View Steven Gehrke's slides
View Kihong Kim's slides
Following the 2015 annual meeting of the Transportation Research Board, this Friday seminar will showcase some of Portland State University's student TRB research.
Presenters:
Steven Gehrke, GRA in civil and environmental engineering
Toward a Spatial-Temporal Measure of Land Use Mix
Summary: Urban policies have emphasized the importance of mixing land uses in a neighborhood as an intervention beholding of lasting planning and public health benefits. Transportation planning research has identified the potential of efficiency... Read more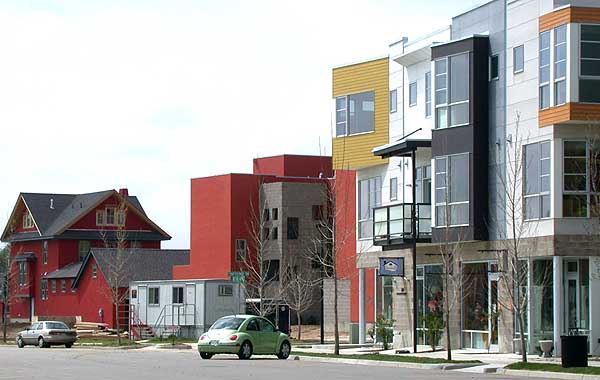
Watch video
View Patrick Singleton's slides
View Ryan Dann's slides
Following the 2015 annual meeting of the Transportation Research Board, this Friday seminar will showcase some of Portland State University's student TRB research.
Presenters:
Patrick Singleton, GRA in civil and environmental engineering
The theory of travel decision-making: A conceptual framework of active travel behavior
Summary: We present a unifying conceptual framework of active travel behavior called the theory of travel decision-making. It integrates seminal travel-related concepts from economics, geography, and... Read more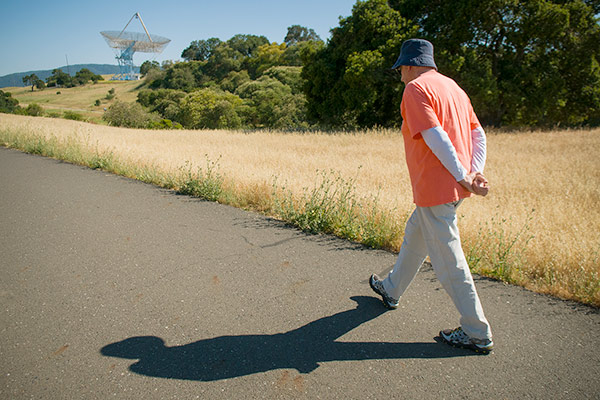
*NEW* LOCATION: Karl Miller Center at PSU, 631 SW Harrison St., Room 465
*NEW* REGISTRATION: Sign up through GoToWebinar
SEMINAR VIDEO
HUAJIE YANG
...
Read more
PRESENTATION ARCHIVE
OVERVIEW
In this presentation we will highlight our past research on human indoor-outdoor wayfinding on an urban college campus. Our work is aimed at facilitating independent travel for people with blindness and low vision. Our research was funded by two successive grants from the National Institute for Transportation and Communities/US Department of Transportation. One of the central research questions sought to capture wayfinding preferences, information needs, and lived experiences of blind and low-vision pedestrian travelers. The projects afforded close collaboration with external partners, and foremost the American Printing House for the Blind. Our focus in the presentation will be on the...
Read more