
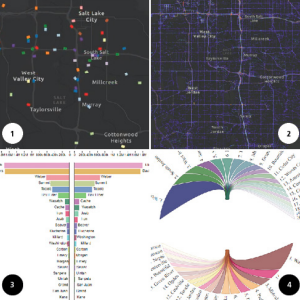
 The University of Utah has a new data visualization service to offer to state DOTs and other agencies. Using Small Starts funding from NITC, researcher Nikola Markovic and his team have developed a suite of visual analysis tools to demonstrate how GPS trajectory data can help accurately model and analyze mobility trends. These data are typically purchased from vendors, which means that transportation agencies must first understand the benefits before they decide to invest in data acquisition. To help agencies see that value, the research team purchased one month of Utah trajectory data to work with, which included detailed information about 2.5 million trips. The researchers created several visual analysis tools to highlight the usefulness and value of GPS trajectory data in transportation planning and performance measurement. The interactive online animations included: Vehicles Traveling; Utah Variable Traffic Density Heatmap; Trips Between Counties, Chord Diagram; and Trips Entering and Exiting Salt Lake City.
We are also using GPS data in the analysis of the Istanbul BRT line with fully GPS-equipped buses and also big data of electronic fare card records to investigate the passengers' trip movements between origin and destination stations during peak hours and the day. In this respect, the final products of your research are useful especially in developing our visual presentations of the outcomes.
-Associate Professor, Yildiz Technical University
Learn more about Visual Exploration of Utah Trajectory Data and their Applications in Transportation, led by Nikola Markovic of University of Utah.


